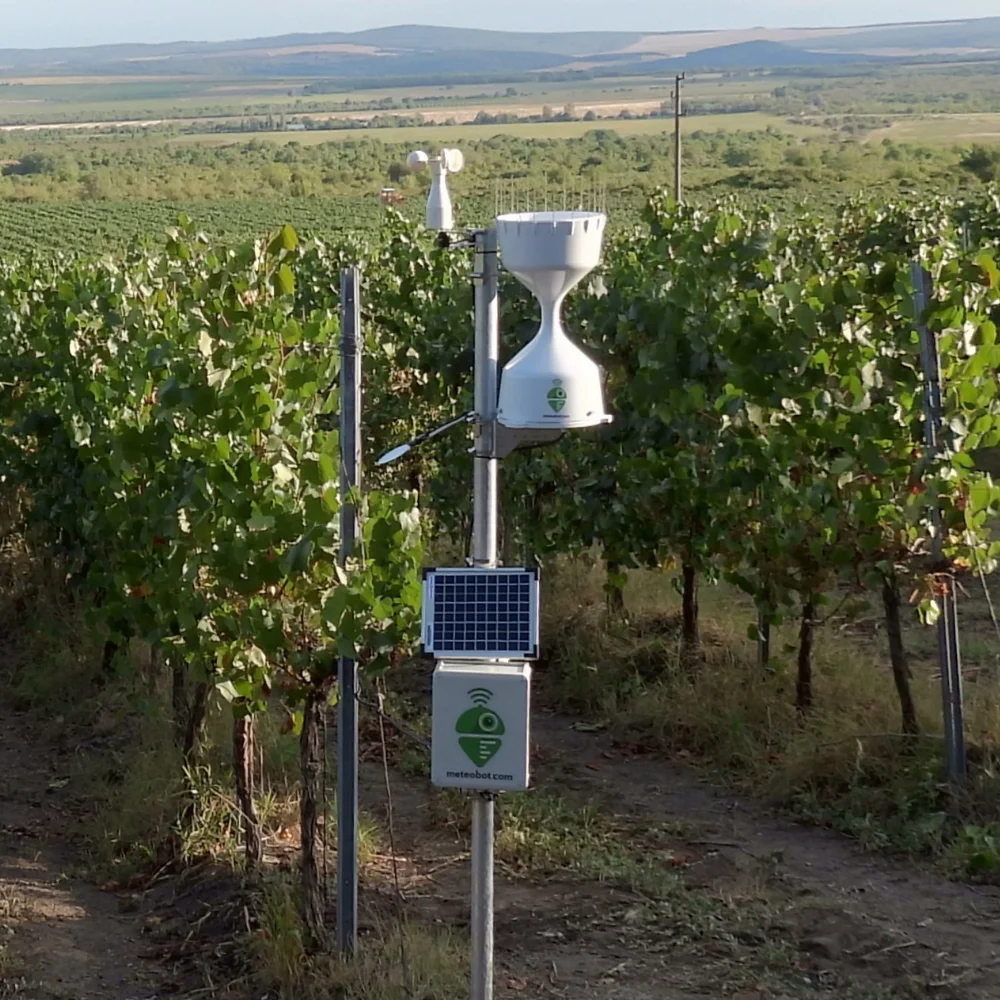
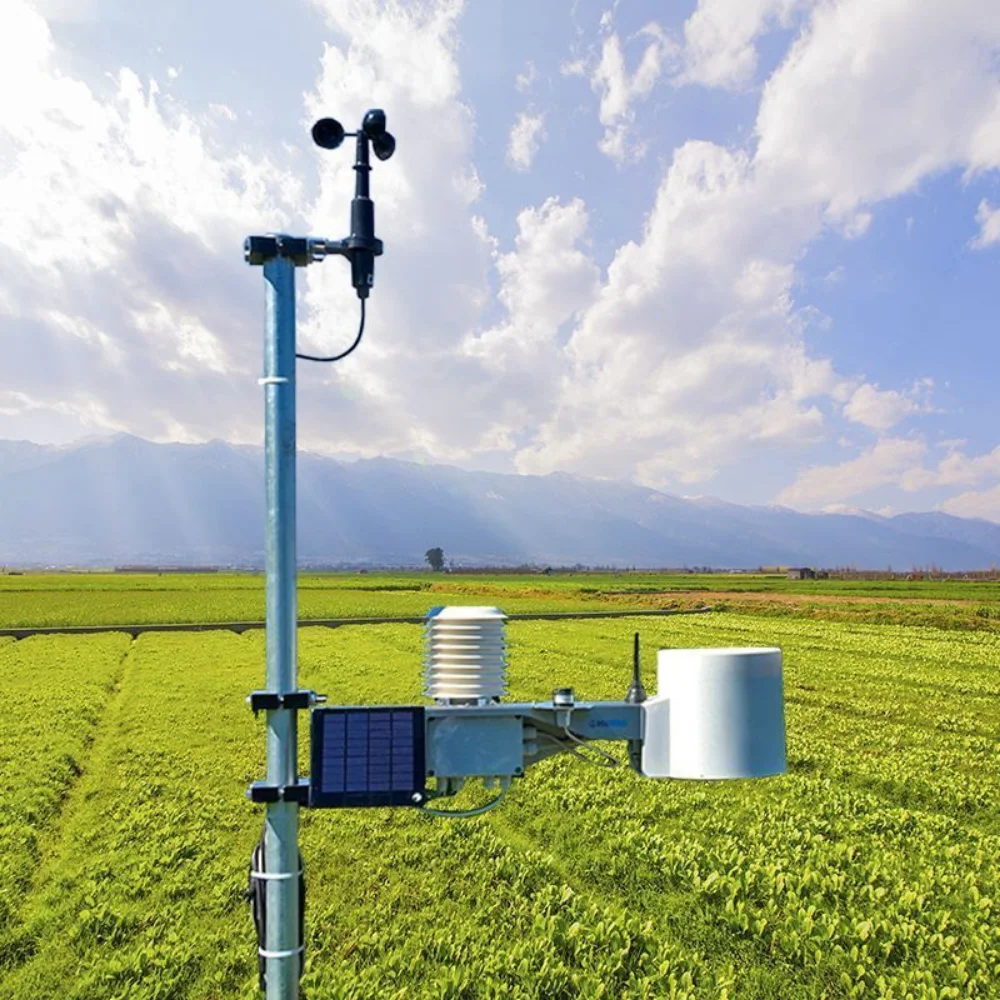
The development of agriculture has always been closely tied to the interpretation and prediction of weather. The first standard rain gauge was developed in 1441, and since then, humans have been attempting to better predict the weather using increasingly advanced tools to protect their crops.
No matter how many technological innovations happen in the agriculture industry, growing food will always depend on the weather where it is grown. Weather is the most important variable in crop health, and being able to closely monitor it is extremely valuable when determining planting times, treatment plans, irrigation schedules, and more.
Growers need to know the weather conditions and pay careful attention to what’s going on outside. “Minimizing weather risk requires knowledge,” says Beth Bishop, the coordinator of Michigan State University's Enviro-weather program. “Growers need to know the current weather conditions and have an idea of what they will be in the near future."
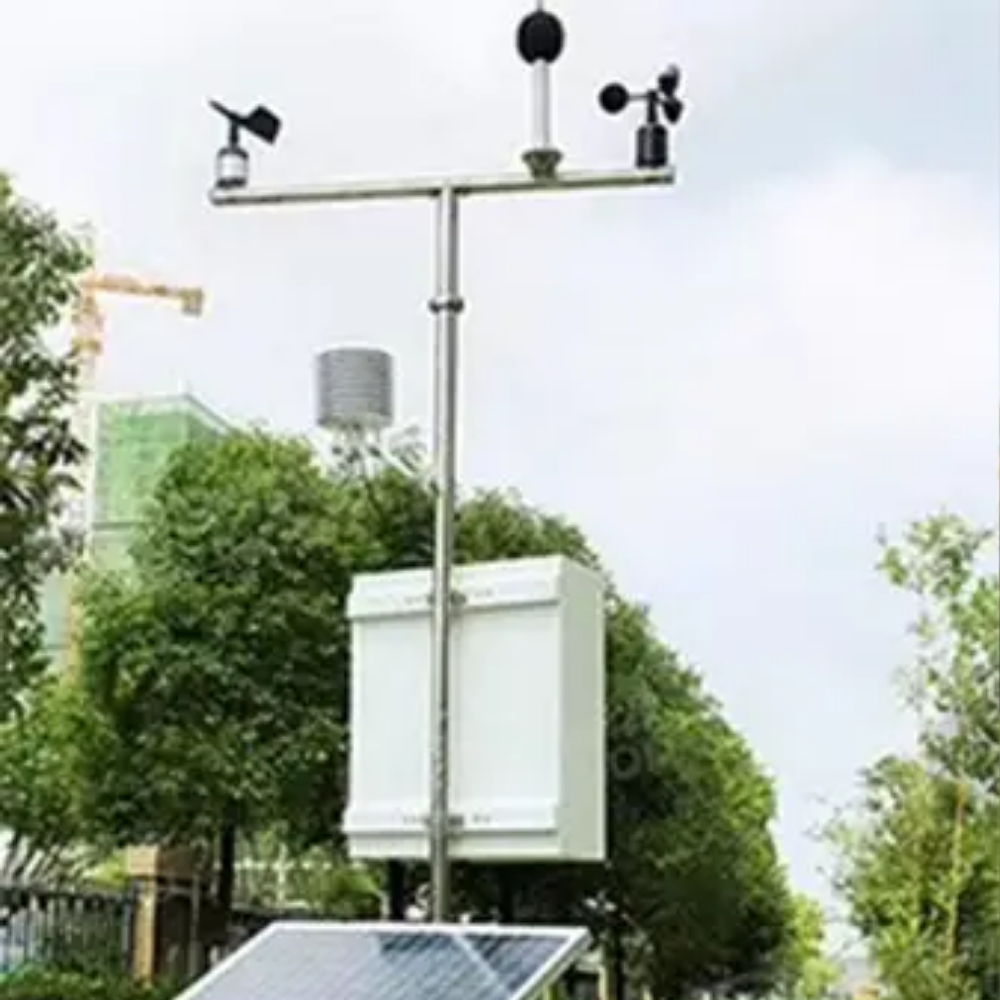
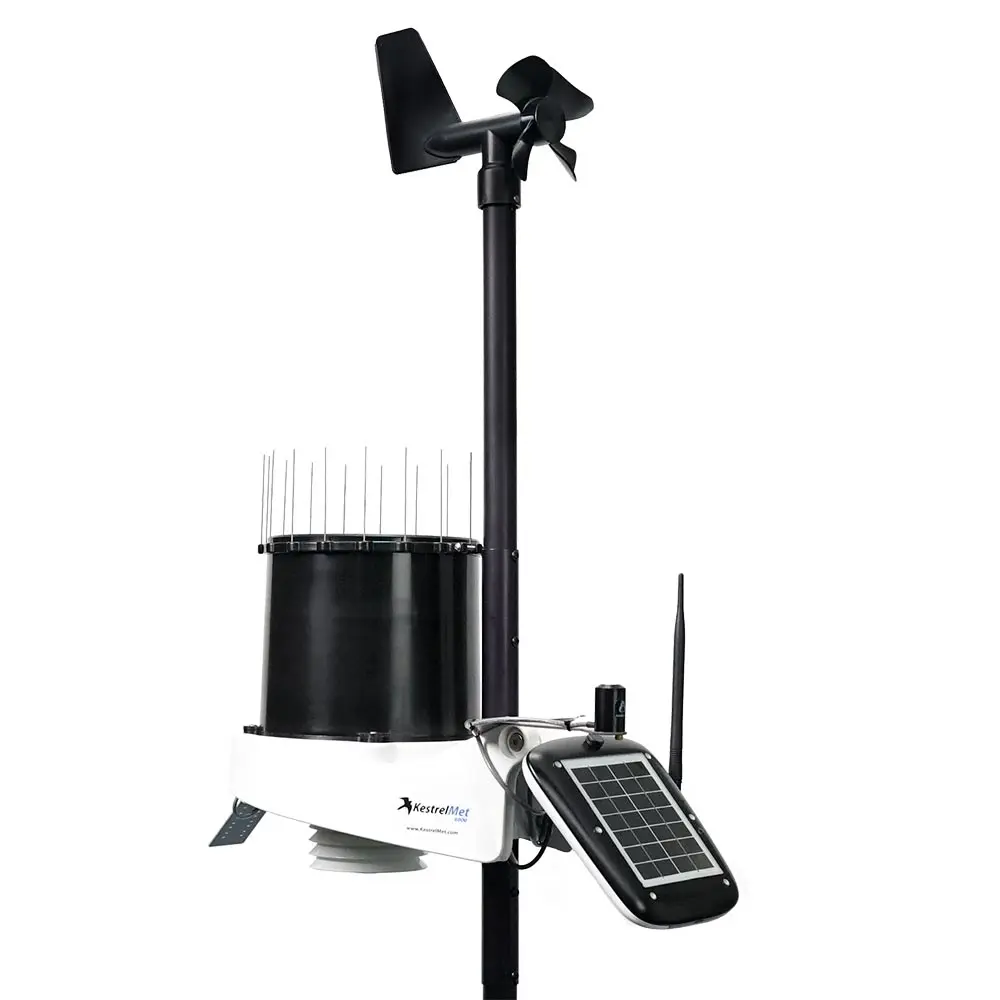
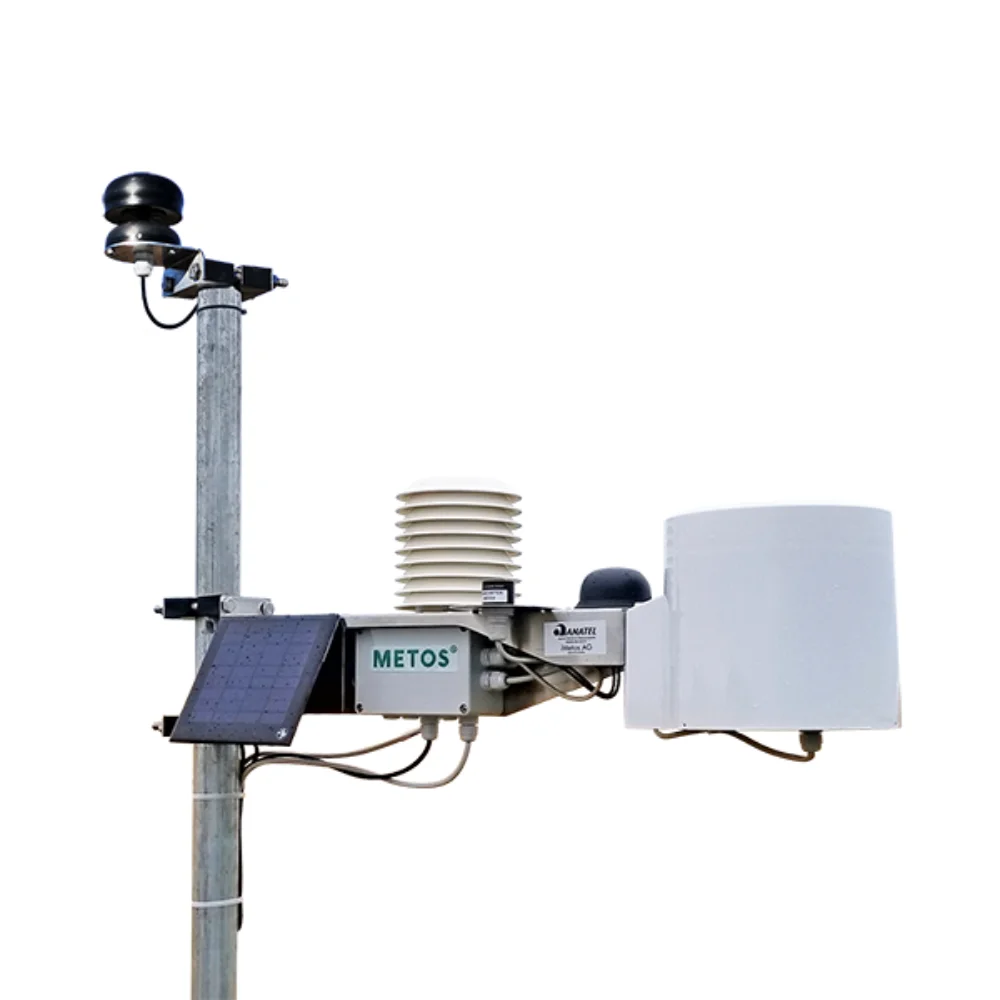
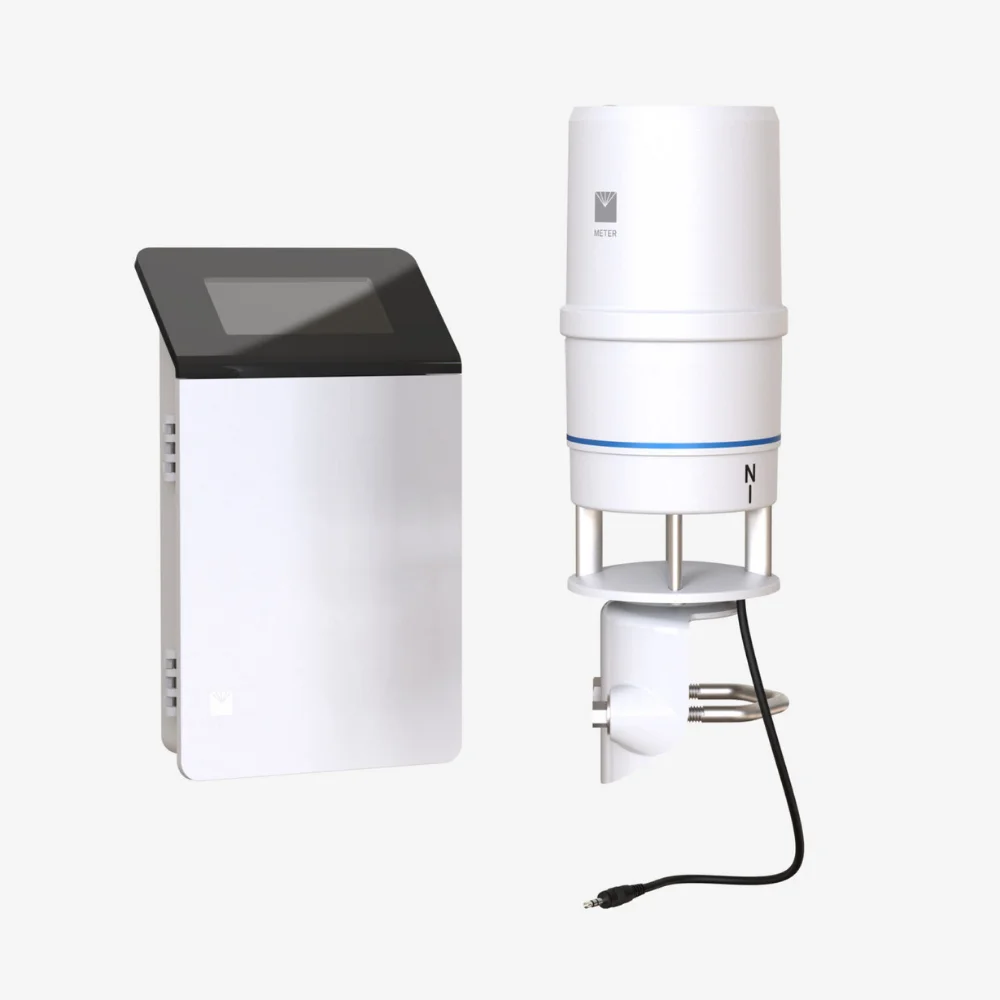
This resource page provides detailed information on the key components of weather stations commonly used by growers and explains when, why, and how to use the data collected from these stations. It also includes a selection of different brands and vendors to help users and growers make informed decisions when purchasing weather stations.
Weather data and precision agriculture
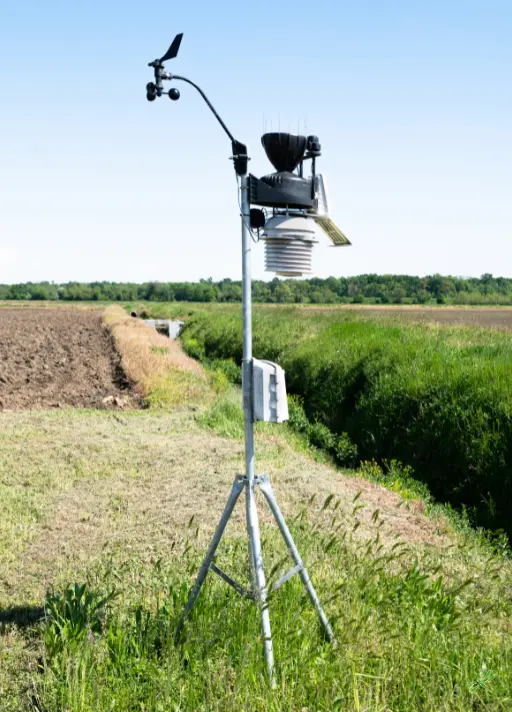
To track and respond to incoming weather changes, growers use a variety of tools including local weather forecasts, weather tracking apps, API weather information integration services, and on-farm weather stations. For growers seeking to improve their precision agriculture practices, localized and granular data from their own weather stations can be invaluable. Especially for large farms or growers managing multiple farm locations, knowing the specific environmental information is extremely useful for making crop protection, scheduling decisions and yield predictions. Even on a single farm, not all growing areas are the same and should not be treated the same way.
Some specific ways weather stations can help growers include:
- Assessing live wind conditions (speed/direction) for spraying chemicals
- Applying herbicides when temperature, humidity, and rainfall conditions assure the best results
- Documenting wind for spray drift risks
- Planning and budgeting for irrigation
- Gauging the potential for pollination via insect or wind
- Forecasting disease risks or insect growth stages to ensure timely treatments
- Predicting crop growth stages, yields, and harvest quality
- Determining risk of crop damage from severe weather events, frost, or heat
- Scheduling planting and harvest dates using calculated Growing Degree Days

How to Calculate Growing Degree Days
Growing Degree Days (GDD) are units used to calculate the projected growth rate and harvest date of crops based on crop-specific base temperatures and daily mean temperatures. GDD can also estimate the presence of pollinators and pests, aiding integrated pest management practices.
Step One: Calculate the mean temperature for each day by adding the high and low temperatures and dividing by two. Some growers use multiple or hourly temperature measures for greater accuracy.
Step Two: Determine the base temperature for your crop. This is the lowest temperature at which the crop will show no significant growth. Many plants show little growth below 5°C.
Step Three: Subtract the base temperature from the mean temperature to get the GDD value for the day. If the base temperature is 10°C and the mean temperature is 15°C, the GDD for the day is 5. If the mean temperature is at or below the base temperature, the value for the day is 0.
Step Four: Repeat the daily GDD calculation and accumulate values. Crops have specific GDD totals required to reach maturity. Accumulating GDD helps predict when the crop will fully develop. Accurate long-term forecasts can help growers predict GDD values in advance for scheduling and planning ahead.
Note: GDD values may differ depending on whether Fahrenheit or Celsius is used.
| Crop Type | Base Temperature °C |
|---|---|
| Spinach | 2.2°C |
| Lettuce | 4.4°C |
| General Plant Growth | 5°C |
| Peas | 5.5°C |
| Asparagus | 5.5°C |
| Corn | 10°C |
| Beans | 10°C |
| Pumpkins | 13°C |
| Tomatoes | 13°C |

Components of Weather Stations
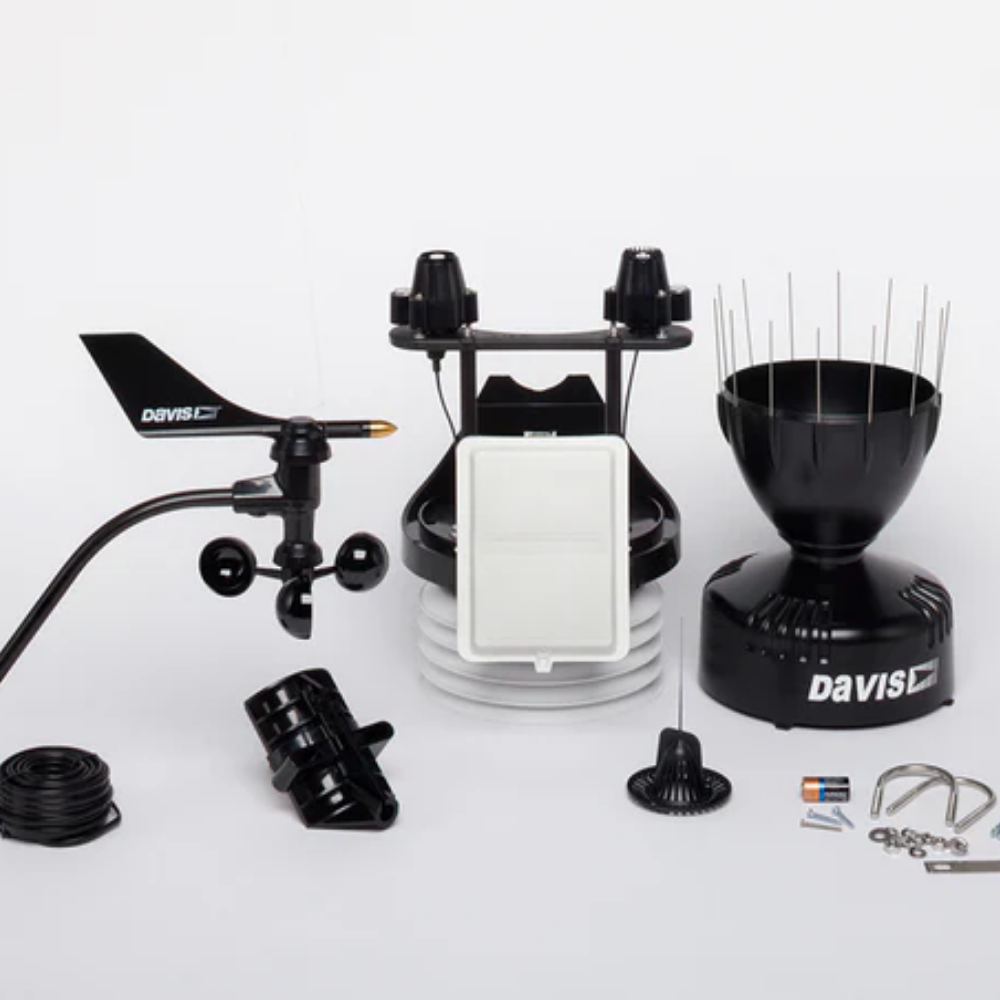
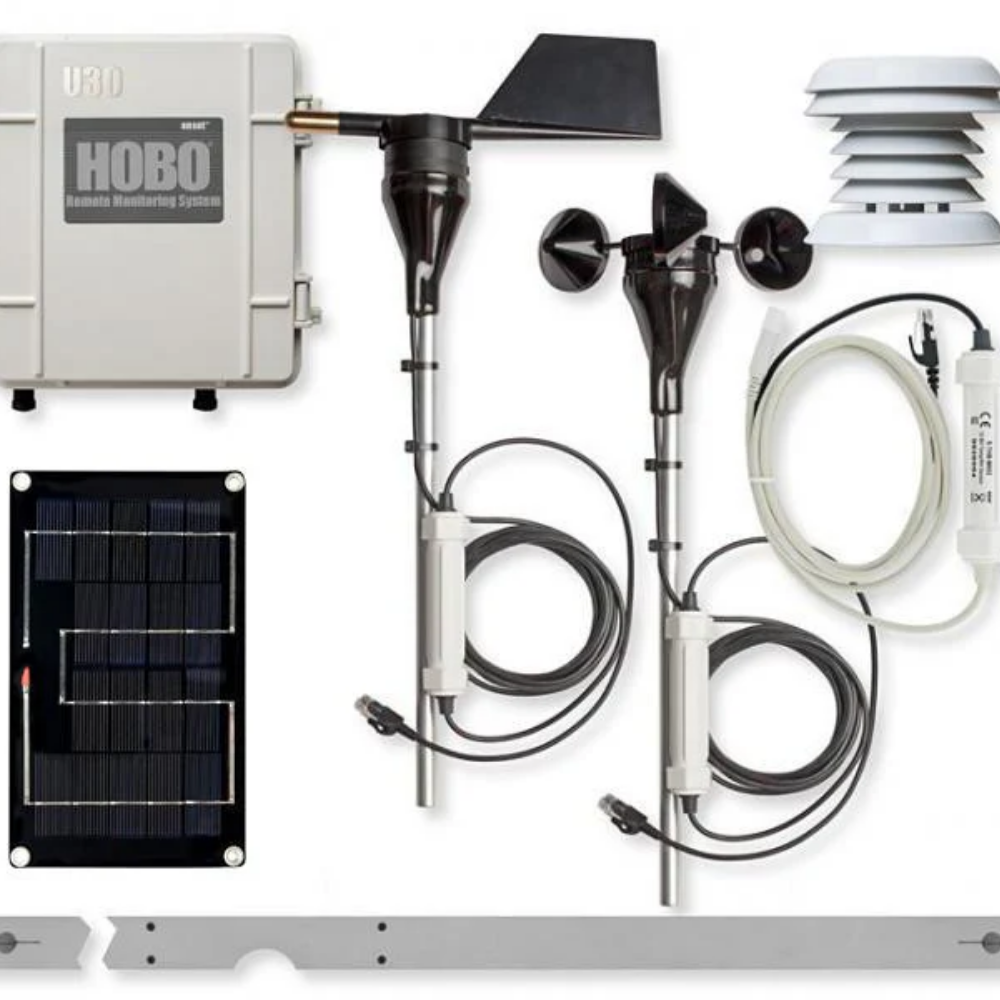
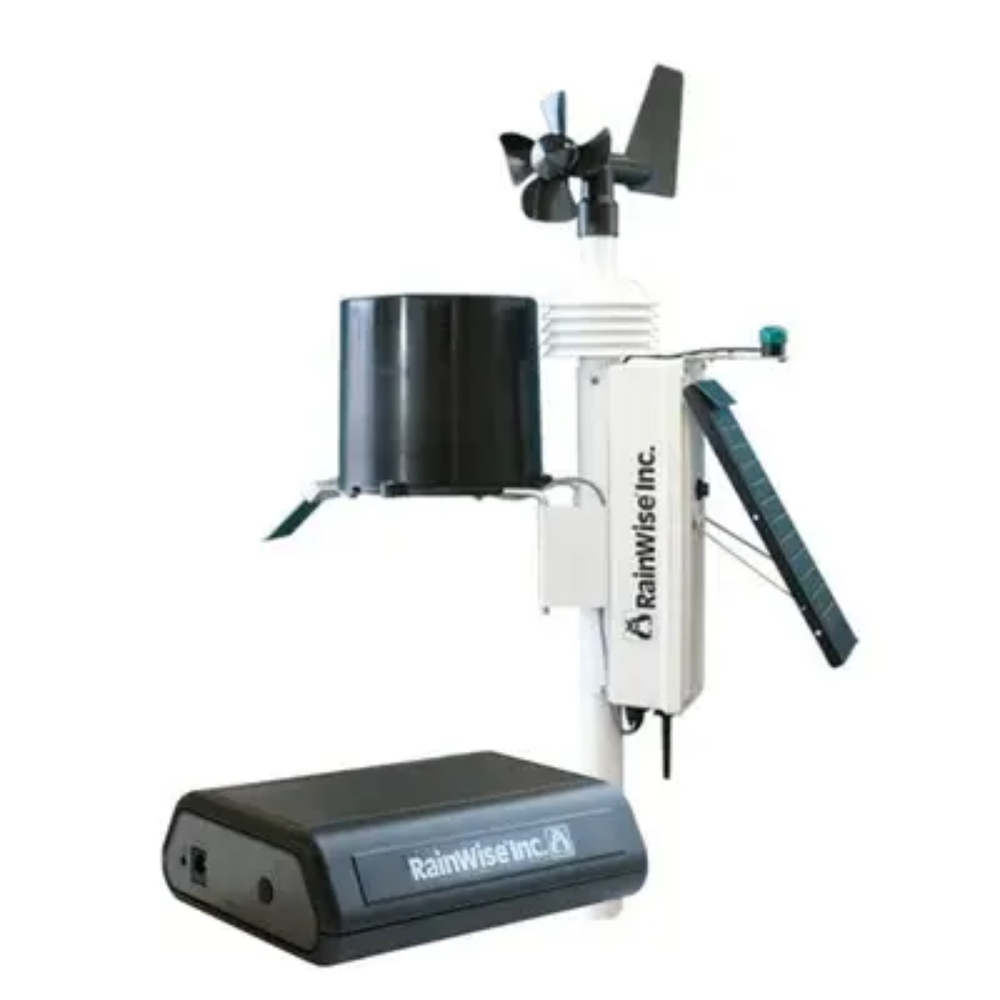
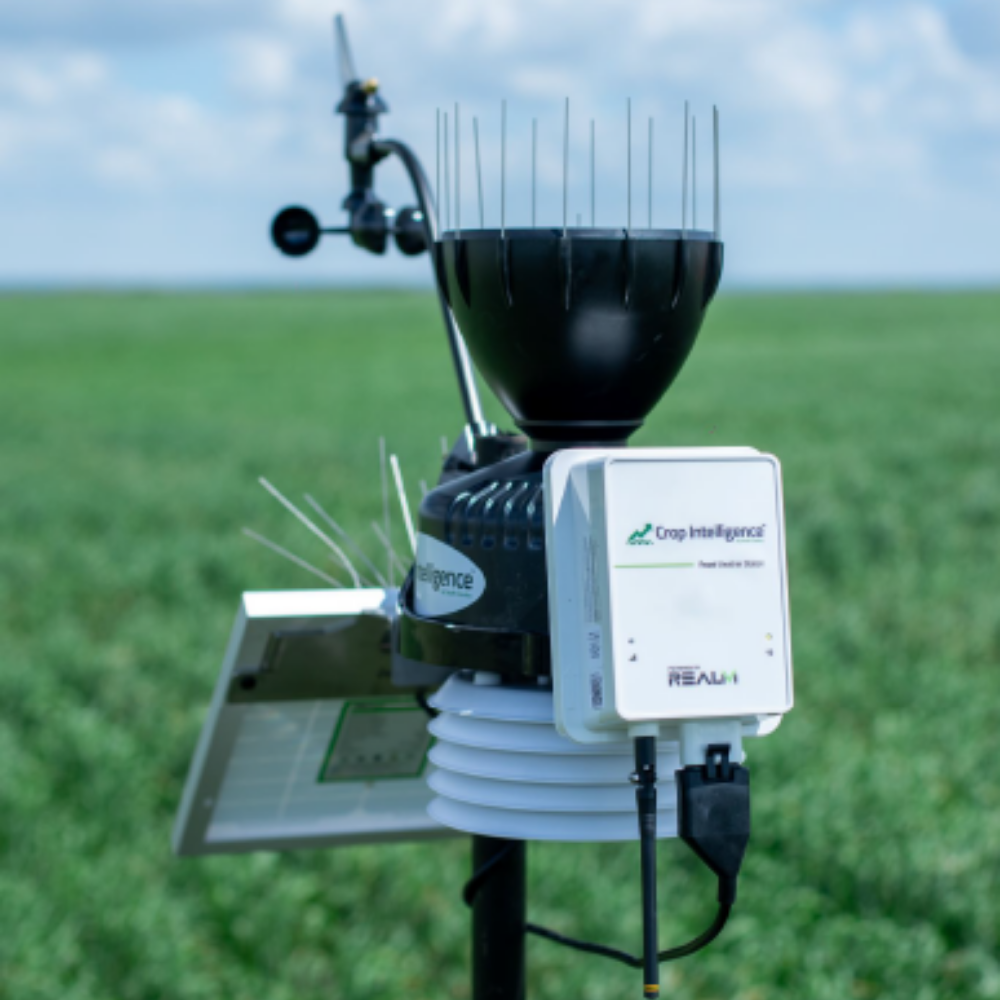
Weather stations can include a huge variety of sensors and measurement tools; a few of the most common components used in agriculture are listed below.
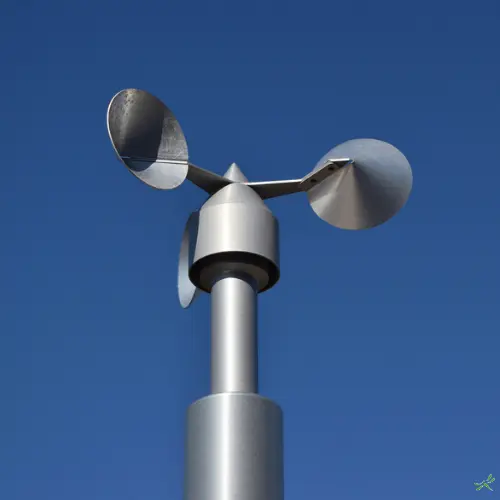
Anemometer - Measures wind direction and speed. Wind speed and direction data helps growers determine if and when to apply chemical and fertilizer applications. It also helps to monitor the potential for pollination on self-pollinating plants like tomatoes.
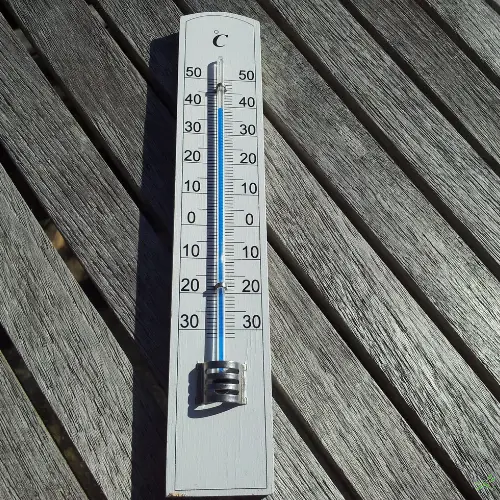
Thermometer - Measures atmospheric temperature. Knowing the temperature is key for things like assessing the need for crop protection from frost and protecting workers from heat. It is also vital to calculate the Growing Degree Days to project crop growth rate, forecast harvest timing, and estimating pest populations.
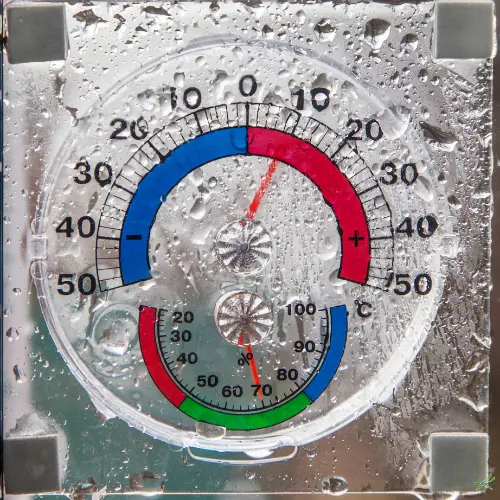
Hygrometer - Measures relative humidity using a percentage measure of water vapor in the air. Monitoring humidity levels enables growers to make better decisions about watering schedules and protect crops from mold and other humidity-related issues.
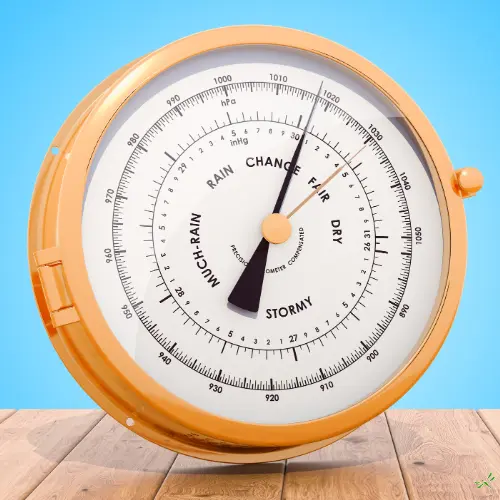
Barometer - Measures atmospheric pressure to predict precipitation. By tracking changes in pressure, growers can anticipate conditions like storms, rainfall, or clear skies, allowing them to take proactive steps in crop management and protect their plants from potential weather-related damage.
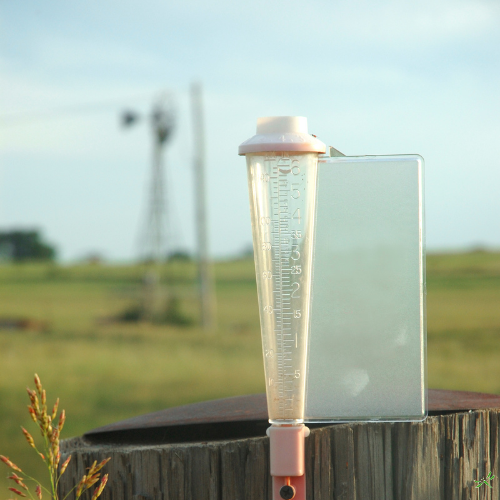
Rain Gauge - Measures liquid precipitation using an open container. They often empty automatically and measure the amount of rainfall over a given time interval. Monitoring how much water crops have received from rain, growers can avoid over or underwatering, leading to healthier plants and more efficient water use.
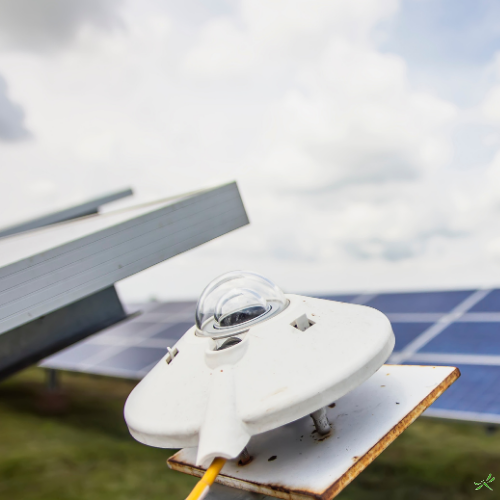
Pyranometer - Measures solar radiation levels from the sun in watts per square meter and is used to calculate ‘evapotranspiration’, the rate at which water evaporates from the soil. It helps growers with scheduling irrigation and track if crops are receiving too much or too little radiation to adjust crop protection practices accordingly.
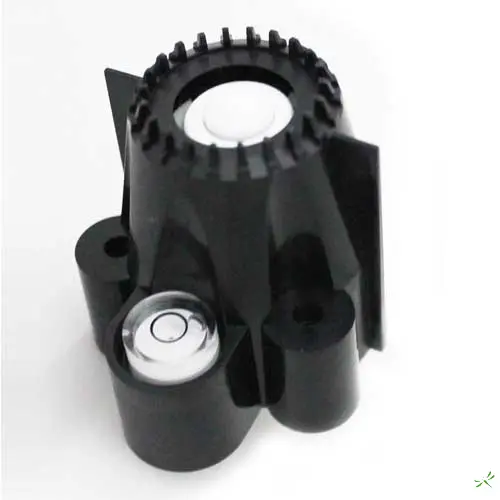
UV Sensor - Measures UV rays from the sun. These sensors are often used for precision growing in particular crops where overexposure to UV rays can stunt leaf growth or affect potency. By tracking UV levels, growers can optimize planting schedules, protect crops from sun damage with shade cloth, and improve overall crop quality.
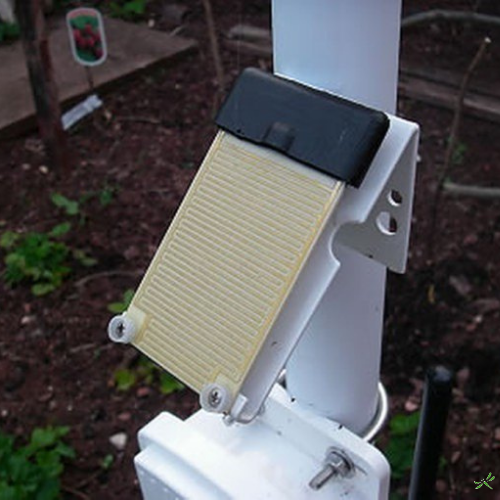
Leaf Wetness Sensor - Measures surface moisture of the plants on a scale of 0-15 (dry to saturated). Data from these sensors are used in fungal disease control and manage irrigation more precisely.
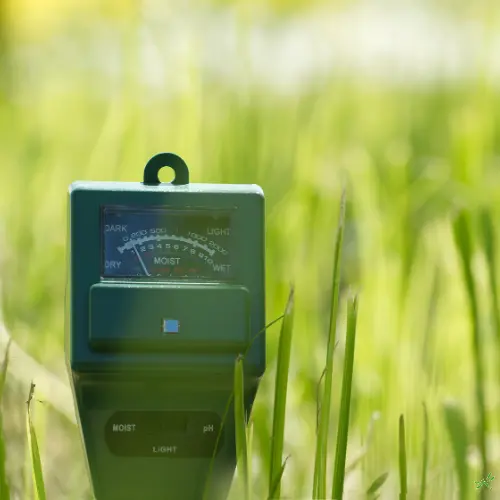
Soil Moisture Sensor - Measures water levels in the soil. Monitoring soil moisture helps a grower prevent overwatering or underwatering, leading to more efficient water use, healthier plants, and improved crop yields.
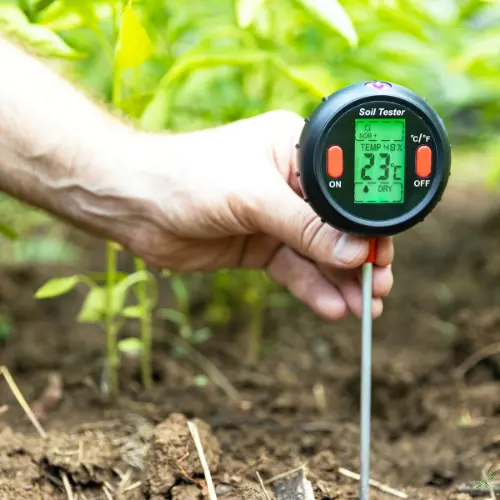
Soil Temperature Sensor - Monitors the soil temperature to detect freezing, or high temperatures that can put crops at risk. It is used to calculate the rate of evapotranspiration. It also helps with planting timing as soil temperature greatly impacts seed germination and growth rates.
10 Top Weather Stations for Farmers
The following list is of weather station brands and vendors favoured by growers for their durability and accuracy. Agricultural weather stations need to be able to withstand harsh conditions and maintain accuracy over seasons. Ideally, on-farm weather stations can be networked together with other stations and send information to growers wirelessly, thereby avoiding scouts having to gather and compile data from remote stations.
Please note price ranges listed below are in USD. Many companies listed below have multiple options for stations, sensors, and services. See the company websites linked in the title for more information about each provider.
| Solar Battery Powered Options | |
| Wireless Data Transmission | |
| Mobile Reporting Options | |
| Approximate Price Range per Station | $400 - $2000 |
| Solar Battery Powered Options | |
| Wireless Data Transmission | |
| Mobile Reporting Options | |
| Approximate Price Range per Station | $500 - $3000 |
| Solar Battery Powered Options | |
| Wireless Data Transmission | |
| Mobile Reporting Options | |
| Approximate Price Range per Station | $1500 - $3000 |
| Solar Battery Powered Options | |
| Wireless Data Transmission | |
| Mobile Reporting Options | |
| Approximate Price Range per Station | $600 - $2500 |
| Solar Battery Powered Options | |
| Wireless Data Transmission | |
| Mobile Reporting Options | |
| Approximate Price Range per Station | Unlisted |
| Solar Battery Powered Options | |
| Wireless Data Transmission | |
| Mobile Reporting Options | |
| Approximate Price Range per Station | $ 1000 - 2500 |
| Solar Battery Powered Options | |
| Wireless Data Transmission | |
| Mobile Reporting Options | |
| Approximate Price Range per Station | $ 500 - 2500 annual subscription |
| Solar Battery Powered Options | |
| Wireless Data Transmission | |
| Mobile Reporting Options | |
| Approximate Price Range per Station | unlisted |
| Solar Battery Powered Options | |
| Wireless Data Transmission | |
| Mobile Reporting Options | |
| Approximate Price Range per Station | $ 700 - 1500 |
| Solar Battery Powered Options | |
| Wireless Data Transmission | |
| Mobile Reporting Options | |
| Approximate Price Range per Station | Unlisted |
These instruments can provide growers with huge amounts of data. Luckily, farm management software can be linked to weather stations in order to process and present this information so that it is easy to read and actionable for the grower. Linking weather data with farm production practices and harvest yield records helps enable growers to maintain agile and effective precision farming practices
Cloud-based farm management platforms integrating with weather stations and remote data sensors allow users to aggregate their data with other real-time farm data such as soil data, weather data, and satellite data to establish more comprehensive insights about their operations.
