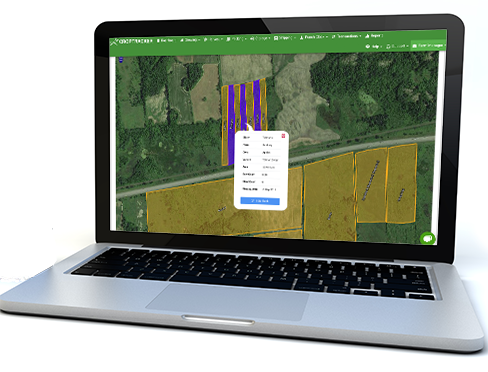
Croptracker is an award winning cultivation management software for the growers of cannabis and industrial hemp.
Croptracker's comprehensive cultivation management software helps growers and producers around the world to maintain accurate records, enhance their traceability, and manage labor and production costs, from seed to sale.
Since 2006, Croptracker has been designed with the help of growers to enhance productivity and yield with our mobile and desktop platforms.
ABOUT CROPTRACKER
Features
Spray Record Keeping
Croptracker’s pesticide tracking system lets you create and access records with ease from your smartphone, tablet, or computer. Easily record sprays and pesticide application by block or row, and analyze usage and costs over time.
Let Croptracker automatically maintain your chemical inventory based on your purchase and application records. Track PHI and REI dates to calculate residue limits, and remain compliant with application regulations in your area.
Harvest Yield Records
Easily track your harvest and yield patterns with the harvest module.
Record harvest events, print tickets with barcodes for traceability, and track your workers in the field or greenhouse from your mobile device. Easily scan tickets with your phone camera at storage or packing time, and keep your data secure on the cloud.
Packing Traceability Records
Manage your post harvest activities with Croptracker.
Record packing, track the amount and type of packing material used while processing products, and monitor your costs and inventory with easy-to-read reports. Trace the history of a product from seed to sale.
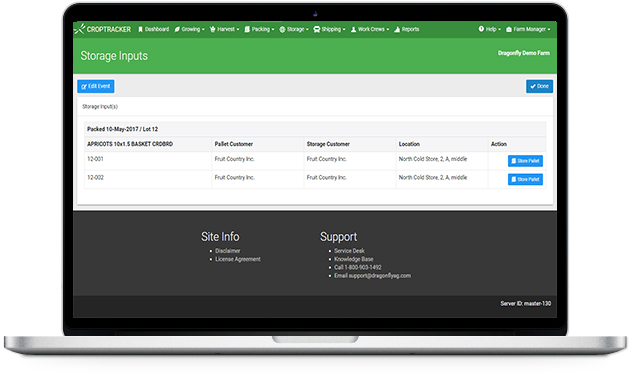
Storage Records
Croptracker’s storage module helps growers manage inventory, track inventory locations, and improve traceability.
Record storage stalls with aisle, row, and rack names and view stored product details such as grade, strain, quantity, and location.
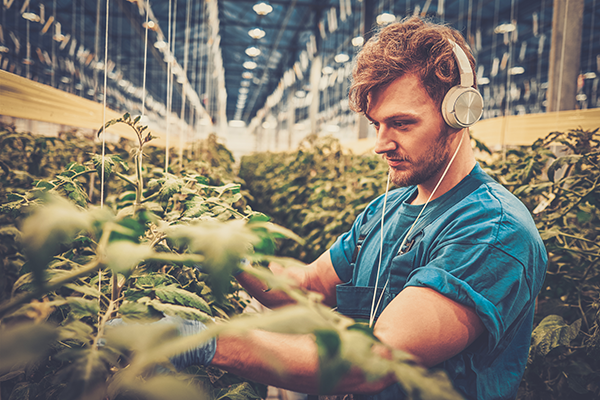
Production Practice Tracking
Track every task in your operation, from planting to weeding to fertilizing, at every stage of the crop cycle. Fine tune your practices to improve quality and yield.
Track labor and equipment costs for production practices all across your operation, and scale your Croptracker platform as you grow.
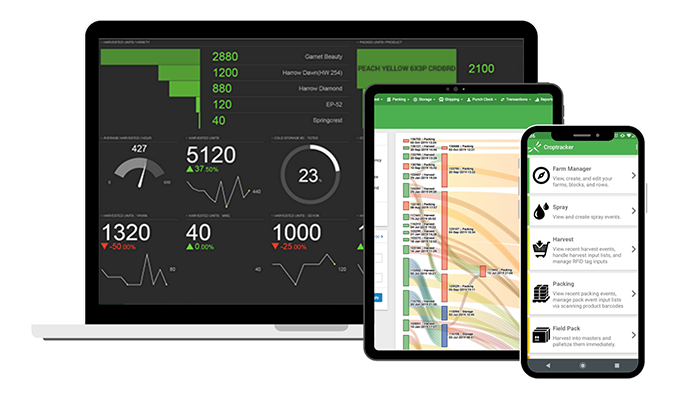
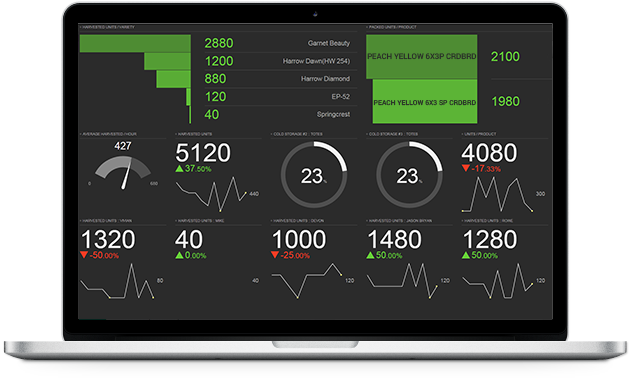
Analytics & Reports
Benchmark and access performance reports to rate your compliance with laws, regulations, and requirements.
Quickly streamline all your data into single reports for auditors, retailers, and more.
Shipping
Generate shipping waybills, reports, and manifests straight from Croptracker to comply with transporation regulations in your area.
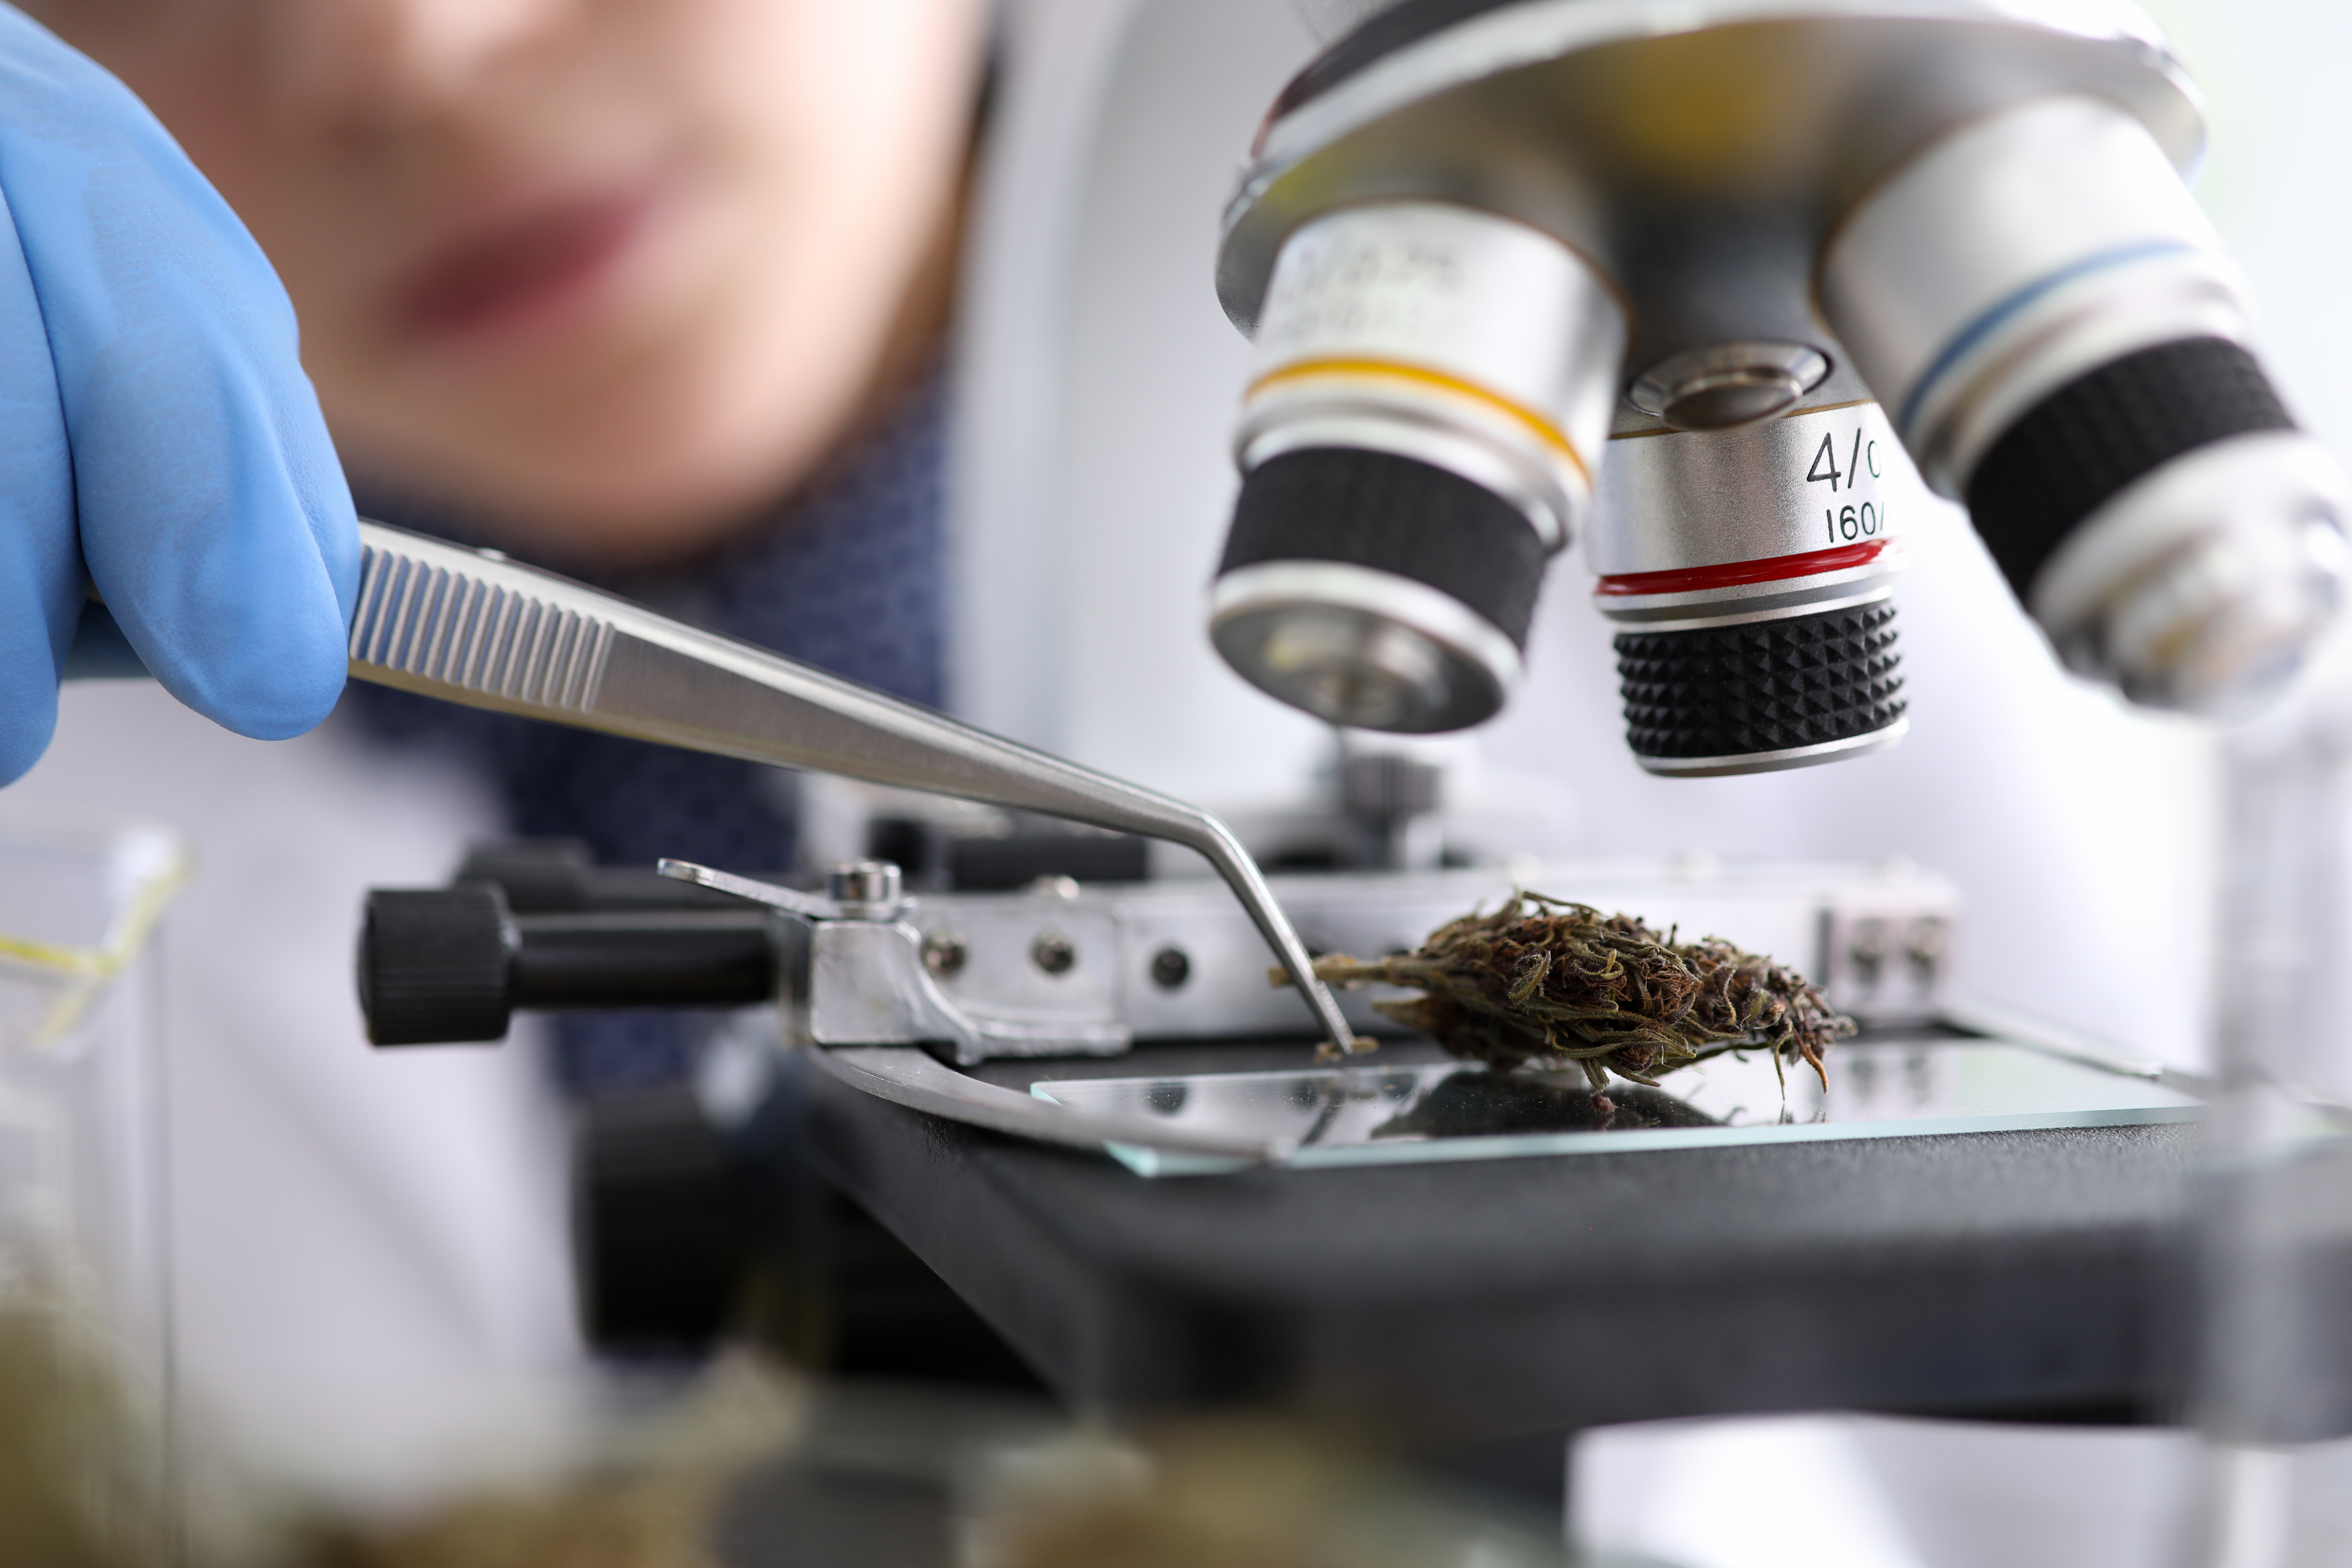
Easily upload files and pdfs with test and processing records. Cloud based records keep your product and your data together, every step of the way.
Receiving Records
Keep precise records of what enters your facility.
View incoming inventory in transit, and create links between received and processed product.